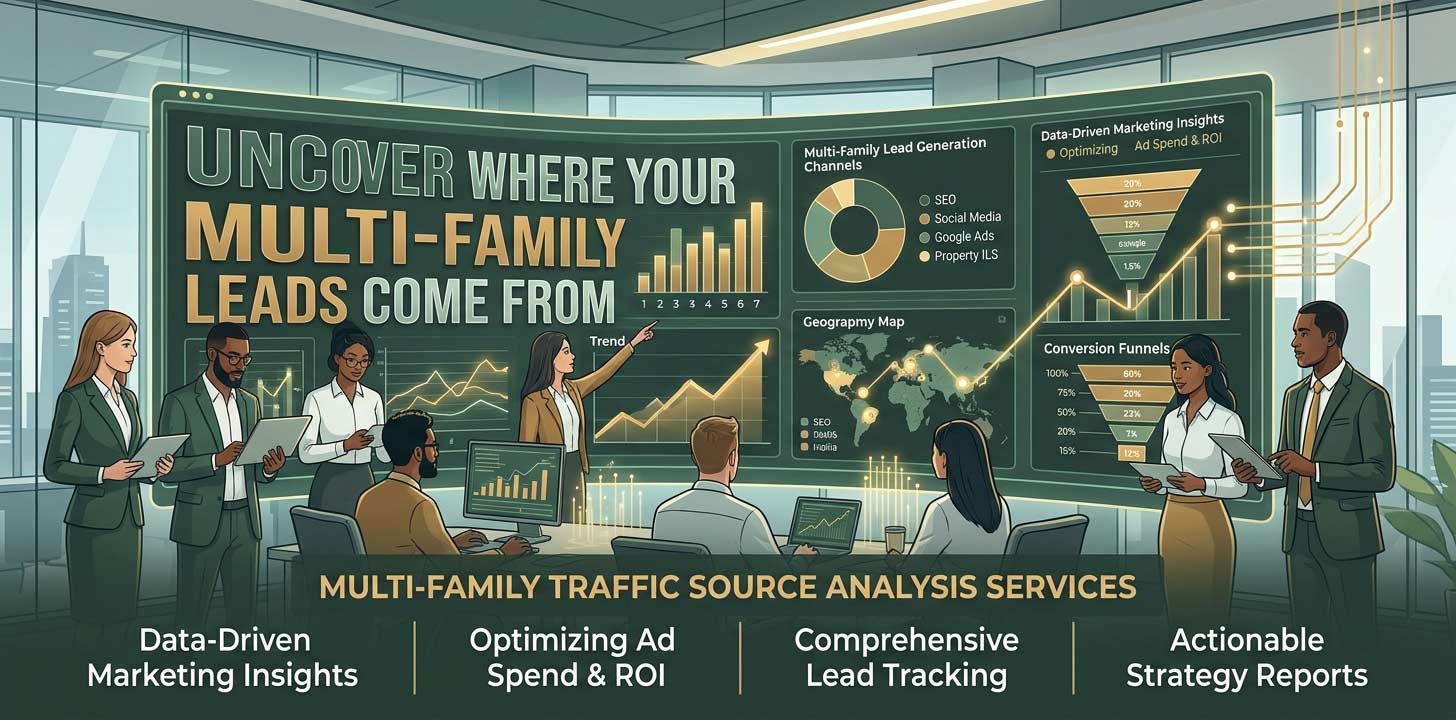
Professional Traffic Source Analysis for Apartment Communities
Traffic volume is the vanity metric of apartment website analytics. A community generating 8,000 monthly website sessions from five different marketing channels looks impressive—until traffic source analysis reveals that 5,400 of those sessions come from a single ILS referral source converting at 4.2%, while 1,200 sessions from organic search are converting at 11.8%, and 800 sessions from paid social are converting at 0.3% on a budget that costs more per month than the organic SEO program generating nearly triple the conversion rate. Without traffic source analysis, these patterns are invisible—and apartment communities routinely invest thousands of dollars per month in channels that deliver high session volume but minimal qualified leads while underfunding the channels producing their highest-quality prospects. Our specialized multifamily traffic source analysis services help apartment communities throughout Los Angeles, California, and nationwide cut through the noise of raw traffic numbers to understand exactly which sources are genuinely driving leasing outcomes—and restructure their marketing mix accordingly.
With over 10 years analyzing website traffic for apartment communities and property management companies, we have developed the methodologies, benchmarks, and multifamily market context that allow us to interpret traffic source data with a precision and strategic depth that generic analytics reporting simply cannot provide.
What is Apartment Website Traffic Source Analysis?
Traffic source analysis is a deep-dive examination of the origins, behavior, and conversion performance of every visitor arriving at your apartment website—going well beyond the channel-level summaries available in standard GA4 reporting to produce a quality-adjusted, cost-calibrated evaluation of each traffic source's genuine contribution to your leasing pipeline. It answers the questions that matter for leasing decisions: not just how many visitors came from each channel, but how engaged those visitors were, how likely they were to take a meaningful action, how much each conversion cost relative to the channel's investment, and which specific sub-sources within each broad channel category are responsible for the most and least valuable traffic. The output is a clear, prioritized map of your marketing mix's actual performance—and a specific set of reallocation recommendations that restructures your budget around what is genuinely working.
Our Apartment Traffic Analysis Services Include:
Why Choose Our Apartment Traffic Analysis Services?
1. Quality-Adjusted Analysis, Not Just Volume Counting
The most common error in apartment website traffic analysis is treating all sessions as equal—reporting traffic volume by source without adjusting for the dramatic quality differences between sources. A session from a prospect who found your community through a specific organic search for "pet-friendly apartments in Silver Lake," spent four and a half minutes on your website, viewed three floor plans, and clicked your phone number is not equivalent to a session from a bot-adjacent referral source that lasted three seconds and bounced from the homepage. We analyze traffic quality across multiple behavioral dimensions—engagement duration, pages visited, scroll depth on key pages, conversion action completion—and produce a quality-adjusted ranking of every traffic source that reveals the genuine hierarchy of your marketing channels rather than the volume-distorted version that standard reporting produces.
2. Sub-Source Precision That Broad Channel Categories Obscure
Standard GA4 channel groupings consolidate traffic into broad categories—organic search, referral, social, direct—that mask the significant performance differences between sub-sources within each category. Apartments.com referral traffic and Zillow referral traffic both appear as referral traffic in standard reporting, but they frequently convert at very different rates and cost very different amounts per month—and knowing which performs better for your specific community is directly actionable budget intelligence. Similarly, organic search traffic from neighborhood-specific searches and organic search traffic from brand name searches behave quite differently and warrant different strategic responses. We break every broad channel category into its meaningful sub-components and analyze each one independently, producing the granular intelligence that channel-level reporting routinely buries.
3. Direct & Dark Traffic Attribution That Recovers Lost Intelligence
Direct traffic—visitors who arrive at your website with no referral source recorded—is one of the most consistently misunderstood and underanalyzed categories in apartment website analytics. In most GA4 implementations, direct traffic is a catch-all that includes genuine direct visits from people who typed your URL directly, email campaign clicks where UTM parameters were not applied, some mobile app referrals, HTTPS-to-HTTP referral stripping, and other miscategorized traffic. For the average apartment website, a significant portion of the traffic labeled as direct is actually attributable to specific marketing activities that were not properly tagged. We investigate your direct traffic category systematically, identifying the patterns that indicate miscategorized campaign traffic and recovering the attribution intelligence that helps you understand the true contribution of every channel to your website's traffic mix.
4. Seasonal Pattern Analysis That Improves Year-Round Budget Allocation
Apartment website traffic is not evenly distributed across the calendar year—and neither is the relative performance of different traffic sources. Organic search traffic tends to lead the seasonal leasing cycle, building in the late winter months as renters begin early research before the spring peak. Paid advertising performance fluctuates with competitive bidding dynamics that intensify during peak leasing season. ILS referral traffic volume correlates with the platform's own seasonal advertising investment. Understanding these seasonal patterns by source—not just in aggregate—allows you to align your marketing investment more intelligently with the natural demand cycle: investing more heavily in the channels that perform best during their respective peak periods and pulling back from channels whose performance degrades during seasonal competitive pressure.
"We had been treating all our website traffic as roughly equivalent and making budget decisions based on total session counts. The traffic analysis showed that our organic search visitors were converting at nearly six times the rate of our paid social visitors, but we were spending four times as much on paid social as on SEO. Shifting that ratio changed our cost-per-lead dramatically within one budget cycle."
- Regional Marketing Manager, multi-community portfolio in Los Angeles County
The Benefits of Traffic Source Analysis for Apartment Communities
Reallocate Budget from Low-Quality to High-Quality Sources Immediately
The most immediate financial benefit of traffic source analysis is the budget reallocation it enables—often within the same month the analysis is completed. When the data clearly shows that one traffic source is converting at 8% while another is converting at 0.8% but receiving comparable investment, the case for reallocation is self-evident and requires no further justification. For most apartment communities, traffic source analysis identifies at least one significant budget reallocation opportunity on the first analysis—a channel consuming meaningful marketing spend while producing a fraction of the qualified leads that better-performing channels generate per dollar. Recovering and redirecting that budget typically produces an immediate improvement in total lead volume with no increase in total marketing expenditure.
Optimize Each Channel for Its Specific Audience Behavior
Traffic source analysis reveals not just which sources perform best in aggregate, but specifically why certain sources underperform—which pages they land on, where they drop off, what they search for, how they differ from high-converting sources in their behavioral patterns. This diagnostic depth enables targeted optimization: adjusting the landing page experience for ILS referral traffic that tends to arrive expecting specific availability information, improving the mobile conversion path for paid search traffic that skews heavily mobile, adding the neighborhood context content that organic search visitors from location-specific queries are arriving to find. Each source-specific optimization compounds the overall conversion rate improvement rather than applying a generic fix that helps some sources modestly while leaving others unchanged.
Understand the True Role of Each Channel in Your Leasing Funnel
Multi-touch attribution analysis reveals how different traffic sources interact across the leasing journey rather than simply measuring last-touch conversions that credit whichever channel a prospect visited immediately before submitting a contact form. A prospect who discovered your community through an organic blog post about the neighborhood, returned via a Google Maps search two weeks later, and then converted through a paid retargeting ad would have that lease credited entirely to paid retargeting in a last-touch attribution model—despite the organic content being the true point of discovery. Understanding the full conversion path of your highest-quality prospects reveals the awareness-building channels that deserve investment even when their last-touch conversion metrics look modest, and the conversion-capturing channels that would generate nothing without the awareness created by other sources upstream.
Build the Historical Baseline That Makes Future Analysis More Valuable
A single traffic source analysis produces significant immediate value—the reallocation recommendations alone typically justify the investment within a single budget cycle. But the compounding value of traffic source analysis builds over time as each subsequent analysis is interpreted against a growing historical baseline. Your second analysis tells you not just how each source is performing but whether it is improving or declining relative to the prior period. Your fourth analysis reveals seasonal patterns with enough data to distinguish genuine trends from random variation. Your eighth analysis provides two years of monthly traffic quality data that makes it possible to predict with genuine confidence how your marketing mix will perform in the coming season based on what happened in the equivalent period in prior years. The investment in regular traffic analysis appreciates continuously.
Our Traffic Source Analysis Process
Phase 1: Analytics Configuration Audit (Days 1-3)
Before any traffic analysis can produce reliable conclusions, the underlying analytics configuration must be verified as accurate. We begin every traffic source analysis engagement with a thorough audit of your GA4 setup—verifying that all conversion events are firing correctly, that internal traffic has been filtered out, that channel groupings are correctly categorizing your specific traffic sources, that UTM parameters have been consistently applied to tagged campaigns, and that there are no duplicate tracking issues inflating session counts. Where configuration problems exist that would compromise the analysis, we identify and resolve them before the analytical work begins. The quality of traffic analysis conclusions is only as good as the quality of the data being analyzed—and we refuse to produce conclusions from unreliable data.
Phase 2: Historical Data Review & Pattern Identification (Days 3-8)
With verified data in hand, we conduct a systematic review of your website's traffic history—typically analyzing a minimum of six months and ideally twelve or more months of data to distinguish genuine patterns from short-term anomalies. We examine traffic volume trends by source over time, identify seasonal patterns and cyclical variations, flag any significant traffic events—sudden spikes or drops—that correspond to identifiable marketing actions or external events, and build the historical context that makes current performance readings meaningful. For communities with shorter analytics histories, we work with available data while noting the limitations that shorter history periods impose on pattern confidence.
Phase 3: Source-by-Source Quality Analysis (Days 8-14)
The core analytical work examines each traffic source individually across the full quality dimension framework: session volume and trend, bounce rate and engagement rate, average engagement time, pages per session, scroll depth on key pages, conversion event completion rates by type, cost-per-session and cost-per-conversion where cost data is available, device distribution and mobile versus desktop performance differential, geographic distribution of visitors, landing page distribution and effectiveness, and any source-specific behavioral patterns that distinguish the audience arriving from that channel. Each source receives a written quality assessment that synthesizes these dimensions into a plain-language evaluation of what the source is genuinely contributing and where its performance most needs attention.
Phase 4: Cross-Source Synthesis & Recommendations (Days 14-18)
Individual source assessments are synthesized into a cross-source comparison that ranks every active traffic source by quality-adjusted performance—placing cost-per-qualified-lead and conversion rate efficiency side by side in a format that makes the relative value of each source immediately visible. We develop the budget reallocation recommendations that the data supports, estimating the lead volume and cost-per-lead impact of each proposed reallocation based on the current performance data. We also identify the specific optimization actions for each underperforming source that could improve its efficiency before reallocation is necessary—because some sources that appear to underperform in raw data can be significantly improved with targeted landing page or conversion path adjustments rather than reduced investment. The final report is presented with a live discussion session to walk through findings, answer questions, and agree on the priority action sequence.
Traffic Sources We Analyze for Apartment Communities
Organic Search Traffic
Organic search is typically the highest-quality traffic source for apartment websites—visitors who found you by searching specifically for what you offer have demonstrated explicit intent that no other channel can match. Our organic search analysis drills below the channel level to examine landing page performance, keyword theme distribution, brand versus non-brand search split, local versus non-local visitor behavior, and the conversion rate differential between different entry points into your website from organic search. We identify the specific content pages and keyword themes producing the most conversion-qualified organic traffic, the search intent categories your content is capturing well versus missing entirely, and the organic search opportunities that should be the highest priority for future SEO investment based on their demonstrated conversion quality in your current traffic mix.
ILS Referral Traffic
Internet listing service referrals represent one of the most significant—and most frequently misunderstood—traffic sources for apartment websites. ILS traffic often appears strong in volume while performing surprisingly poorly in conversion rate, because a significant portion of ILS referral clicks come from prospects in early research mode who are exploring multiple options rather than actively considering your community specifically. Our ILS traffic analysis separates and compares performance across every individual platform sending traffic to your site, identifies the specific pages ILS visitors land on and where they tend to drop off, assesses whether ILS-referred visitors who do convert look different behaviorally from other converting sources, and provides an evidence-based evaluation of whether each ILS platform's referral traffic quality justifies its monthly investment—a question most apartment communities have never been able to answer with real data.
Paid Search & Paid Social Traffic
Paid traffic analysis requires special attention because the cost visibility of paid channels makes quality assessment directly actionable in budget terms—a traffic source that converts poorly and costs money should be restructured or reduced immediately, whereas an organic source that converts poorly requires a different response. We analyze paid search traffic at the campaign and ad group level where GA4 data allows, comparing the conversion quality of different keyword themes, match types, and audience segments within your paid search program. For paid social traffic, we compare platform performance across Facebook and Instagram and assess the quality differential between prospecting campaigns targeting cold audiences and retargeting campaigns reaching warm website visitors. Cost-per-qualified-lead calculations for each paid sub-source produce the specific optimization priorities for your paid program.
Direct, Email & Dark Traffic
Direct traffic is typically the least understood category in apartment website analytics and often contains the most misattributed traffic. Our direct traffic analysis uses behavioral pattern matching, session timing analysis, and UTM audit methodology to distinguish genuine direct visits from miscategorized email campaign traffic, untagged marketing channel traffic, social media app referrals that strip source data, and bookmark-based return visits. Where email marketing is active, we assess whether campaigns are correctly tagged with UTM parameters and whether email-driven traffic is converting differently from other direct and digital channels. Recovering correct attribution for misclassified direct traffic frequently reveals significant adjustments to the apparent performance of email programs and other marketing channels whose true contribution was being hidden in the direct category.
Frequently Asked Questions About Apartment Traffic Analysis
How much historical data do you need to conduct a meaningful traffic analysis?
Six months of clean, accurately tracked data is the practical minimum for a meaningful traffic source analysis—enough to identify consistent patterns rather than reacting to short-term anomalies. Twelve months is substantially better because it captures a full seasonal cycle, allowing us to distinguish which traffic source variations are seasonal patterns versus genuine performance changes. Twenty-four months or more allows for year-over-year comparison that provides the strongest possible context for interpreting current performance. If your website has been tracking accurately for less than six months, we can still conduct a useful analysis of the available data while being clear about the limitations that shorter history imposes on pattern confidence. This is also an important argument for implementing accurate analytics as early as possible—every month of clean data that accumulates makes future analysis more valuable.
What if a significant portion of our traffic source data is labeled as direct or unknown?
A high direct traffic percentage is one of the most common symptoms of analytics configuration problems—specifically, the absence of UTM parameters on tagged marketing campaigns, incorrect channel grouping configurations in GA4, or referral source stripping that misclassifies other channel traffic as direct. A large direct traffic category is not just an analytical inconvenience—it represents lost intelligence about real marketing channels whose contribution is being hidden rather than measured. We investigate high direct traffic proportions as a standard component of every traffic analysis, using behavioral pattern analysis to identify the most likely sources of miscategorized traffic and recommending the specific configuration corrections that will recover correct attribution going forward. In many cases, recovering correct attribution from a large direct traffic pool meaningfully changes the apparent performance ranking of other channels in the mix.
Can traffic analysis help us decide whether to continue investing in a specific ILS platform?
Yes—this is one of the most direct and immediately actionable questions that traffic source analysis addresses for apartment communities. ILS platforms typically represent significant ongoing monthly expenses, and the decision of whether to maintain, upgrade, or cancel a specific listing is one of the most common and highest-stakes marketing budget decisions leasing teams make. By isolating the referral traffic from each ILS platform and comparing its conversion rate, lead quality, and estimated cost-per-lead against your other traffic sources and against each other, traffic analysis produces the evidence-based evaluation that makes this decision straightforward rather than political. Many apartment communities discover through traffic analysis that their ILS investments have very different return profiles than the platforms' own reporting suggested—and adjust accordingly.
Should traffic source analysis be done once or on an ongoing basis?
Both approaches serve different purposes and both are valuable. A comprehensive baseline traffic analysis conducted once establishes the full picture of your current marketing mix performance and produces the immediate reallocation recommendations that typically generate the largest near-term impact. Ongoing quarterly or semi-annual analyses track how the traffic mix evolves in response to your marketing program changes, seasonal patterns, competitive market shifts, and website updates—building the longitudinal data picture that makes each subsequent analysis more insightful than the last. For communities with active, multi-channel marketing programs making frequent investment decisions, quarterly traffic analysis ensures those decisions are always informed by current data rather than a snapshot that may be six to twelve months old.
How much does apartment traffic source analysis cost?
A comprehensive one-time traffic source analysis for an apartment community website typically ranges from $1,200 to $2,800 depending on the number of active traffic sources, the depth of historical data available for analysis, the complexity of the paid channel structure, and the scope of the recommendations deliverable. Ongoing quarterly traffic analysis programs are available at reduced per-analysis rates for communities that want continuous traffic intelligence rather than periodic snapshots. Traffic source analysis conducted as part of a broader analytics and reporting engagement is available at a reduced rate. Contact us for a customized proposal based on your website's specific traffic profile and your team's analytical intelligence needs.
Ready to Finally Understand Where Your Best Leads Are Actually Coming From?
Your apartment website is generating traffic from multiple sources right now—and some of those sources are producing qualified leasing leads at exceptional efficiency while others are consuming budget with minimal return. Without traffic source analysis, those performance differences are invisible and your marketing investment decisions are made on assumptions that may be costing you thousands of dollars per month in misdirected spend. Our professional multifamily traffic source analysis services give apartment communities throughout Los Angeles, California, and nationwide the precise, quality-adjusted, source-by-source intelligence that makes every marketing budget decision demonstrably smarter and every channel investment measurably more efficient.
Contact us today for a free traffic analysis consultation and we will assess your current analytics configuration, outline the traffic intelligence most valuable for your specific marketing mix, and provide a customized proposal that puts your best-performing lead sources front and center—with no obligation.
Related Analytics & Marketing Services
Complete your analytics intelligence program with our other specialized apartment analytics and marketing services: